🎯 Cause and Effect Diagram (Fishbone Diagram)
📌 Definition:
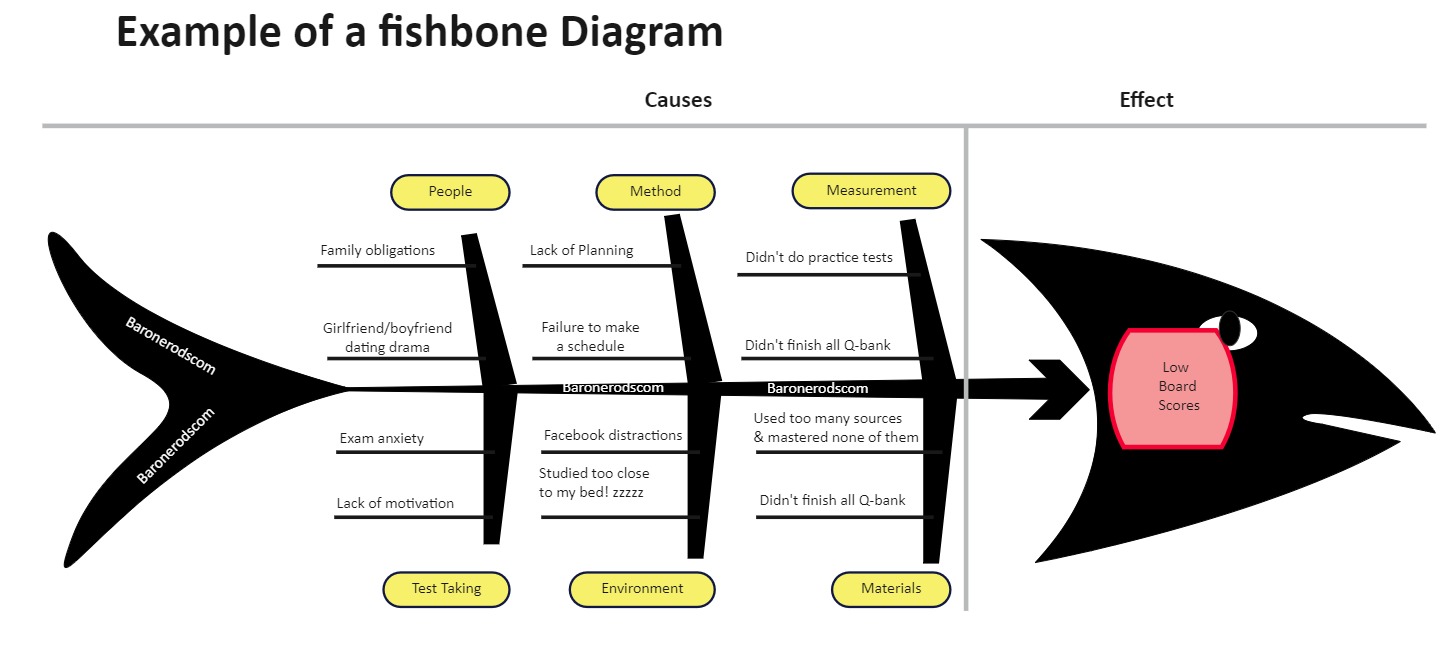
A Cause and Effect Diagram, also known as a Fishbone Diagram or Ishikawa Diagram, is a visualization tool used to systematically identify, explore, and display all the possible causes of a specific problem (effect). It helps teams to identify root causes rather than just symptoms.
🐟 Why It’s Called Fishbone Diagram:
The diagram resembles the skeleton of a fish:
-
The head of the fish represents the problem or effect.
-
The bones branching off the spine represent major cause categories.
-
Sub-branches under each major category represent possible contributing factors.
🔍 Purpose:
-
To identify the root causes of a problem.
-
To organize and categorize potential causes.
-
To promote brainstorming and systematic analysis in quality management.
📚 Structure:
The diagram is typically built from:
-
Effect (problem): written at the head of the fish.
-
Major cause categories: main branches from the spine.
-
Root causes and sub-causes: smaller branches off the main ones.
✅ Main Categories: 5M + 1E
This classification is especially used in manufacturing and industrial analysis, but it can be adapted to other industries.
1. Man (People):
-
Refers to human-related causes.
-
Examples:
-
Inadequate training
-
Operator error
-
Lack of experience
-
Miscommunication
-
2. Machine:
-
Refers to equipment, technology, and tools.
-
Examples:
-
Equipment malfunction
-
Poor maintenance
-
Outdated machinery
-
Inconsistent calibration
-
3. Method:
-
Refers to processes, procedures, and policies.
-
Examples:
-
Lack of standardized work
-
Inefficient procedures
-
Non-compliance with SOPs
-
Poor planning
-
4. Material:
-
Refers to raw materials, components, or consumables.
-
Examples:
-
Low-quality materials
-
Incorrect materials
-
Defective parts
-
Variability in materials
-
5. Measurement:
-
Refers to inspection, testing, and data collection methods.
-
Examples:
-
Inaccurate data
-
Faulty measurement systems
-
Lack of measurement standards
-
Misinterpretation of results
-
6. Environment:
-
Refers to external conditions (physical, social, or organizational).
-
Examples:
-
Temperature or humidity variations
-
Poor lighting or noise
-
Cultural or organizational environment
-
Safety hazards
-
🛠 Steps to Create a Fishbone Diagram:
-
Define the Problem: Write the effect (problem) at the head of the fish.
-
Draw the Main Backbone: This is the central line pointing to the problem.
-
Identify Major Categories: Use 5M+1E or categories relevant to your context.
-
Brainstorm Causes: For each category, list potential causes and sub-causes.
-
Analyze: Look for root causes, relationships, and areas to investigate further.
-
Take Action: Use findings to develop corrective or preventive actions.
🧠 Tips for Use:
-
Use cross-functional teams for broader insights.
-
Don’t rush; focus on identifying root causes, not just surface symptoms.
-
Combine with other tools (e.g., 5 Whys, Pareto Analysis) for deeper root cause analysis.
 EGP
EGP
 USD
USD