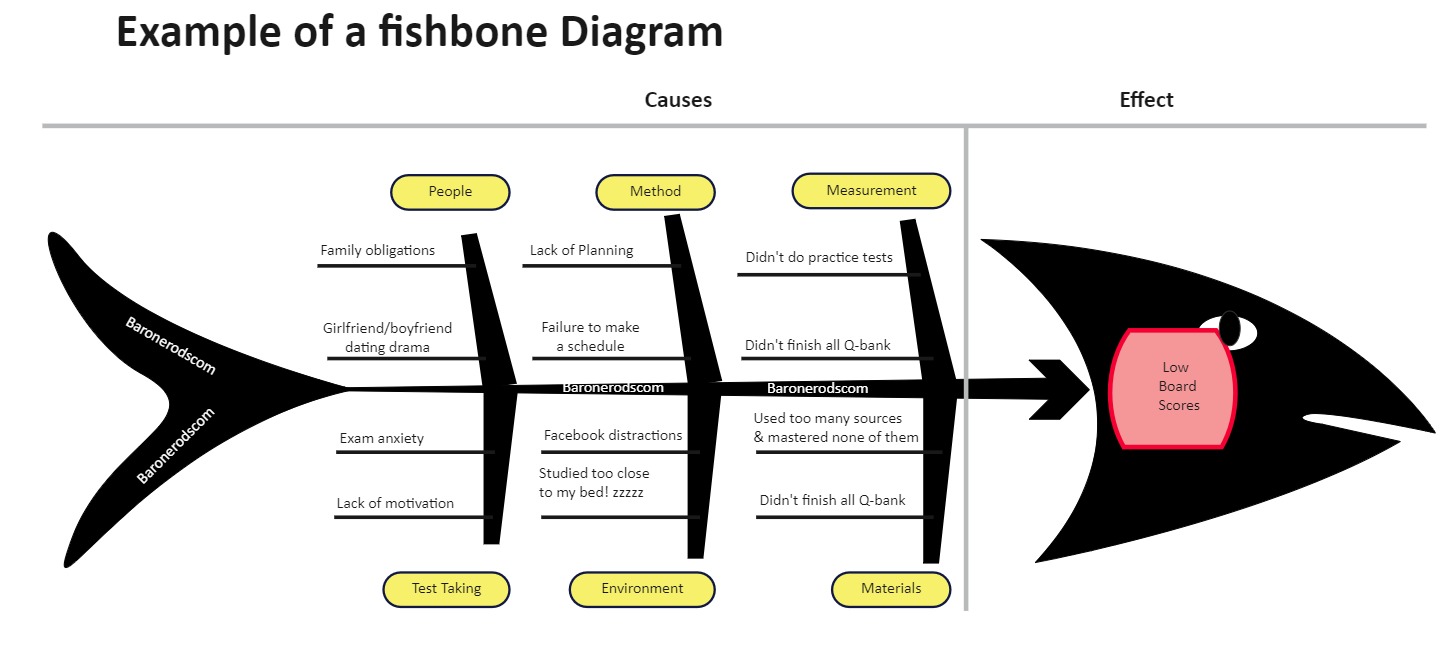
A Cause and Effect Diagram, also known as a Fishbone Diagram or Ishikawa Diagram, is a visualization tool used to systematically identify, explore, and display all the possible causes of a specific problem (effect). It helps teams to identify root causes rather than just symptoms.
Cause and Effect Diagram (Fishbone Diagram)
 EGP
EGP
 USD
USD